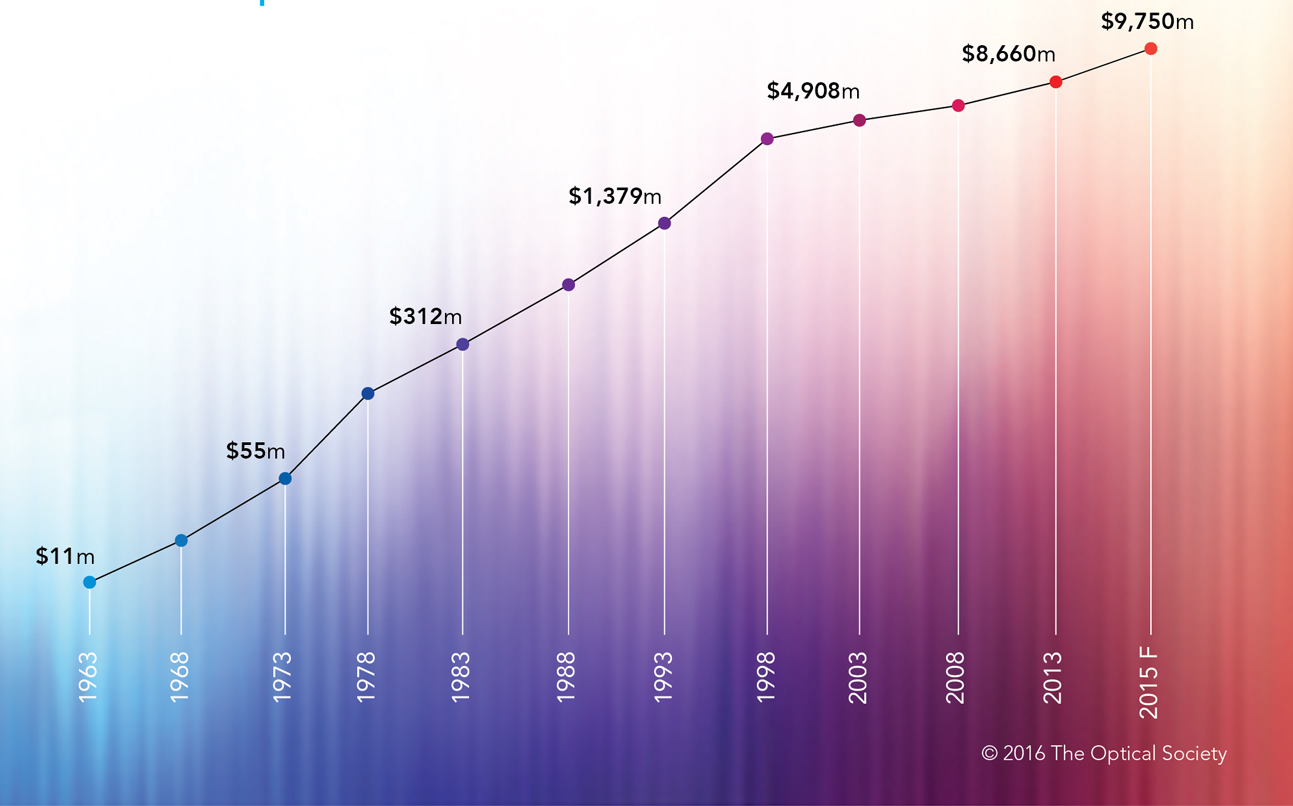
A Year in Optics and Photonics

A Year in Optics
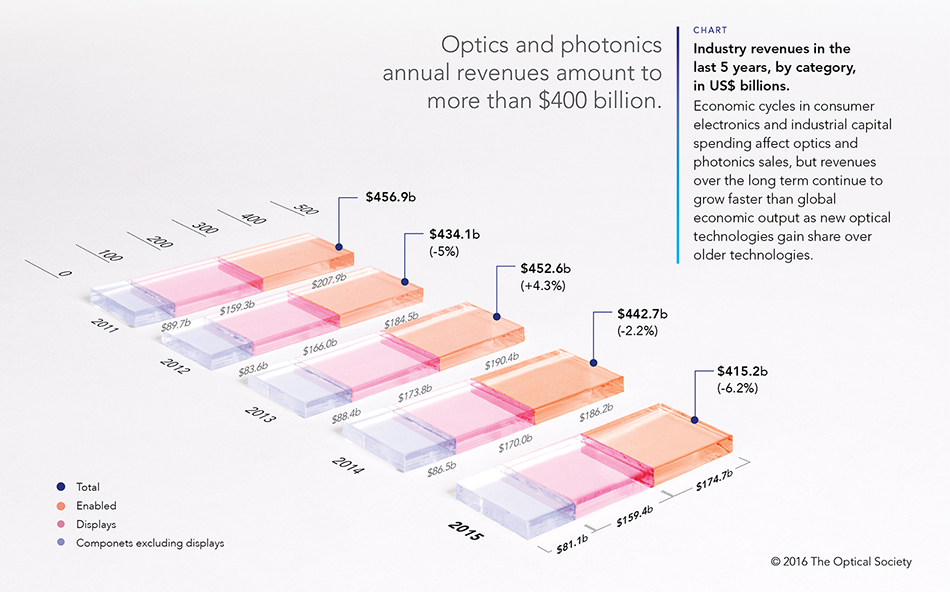
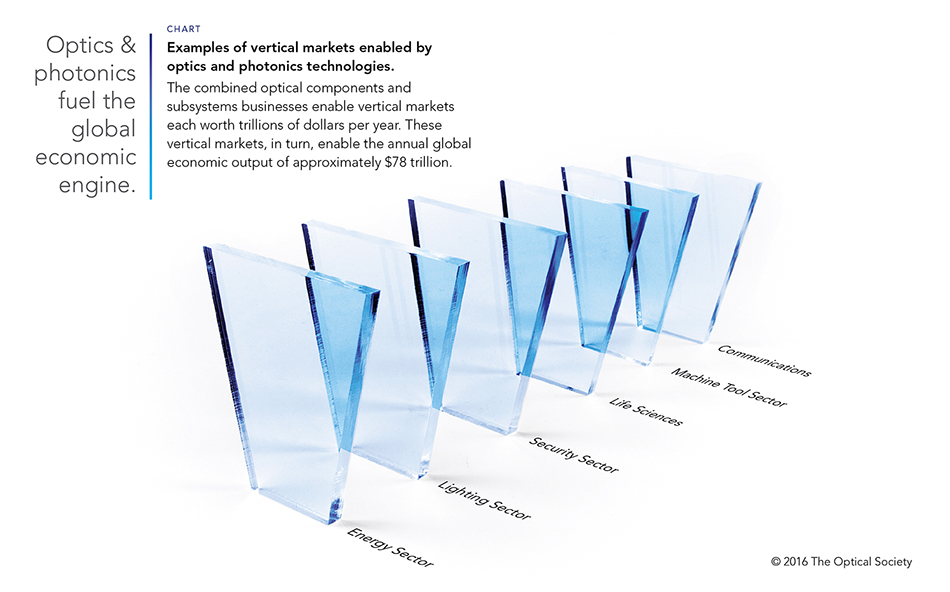
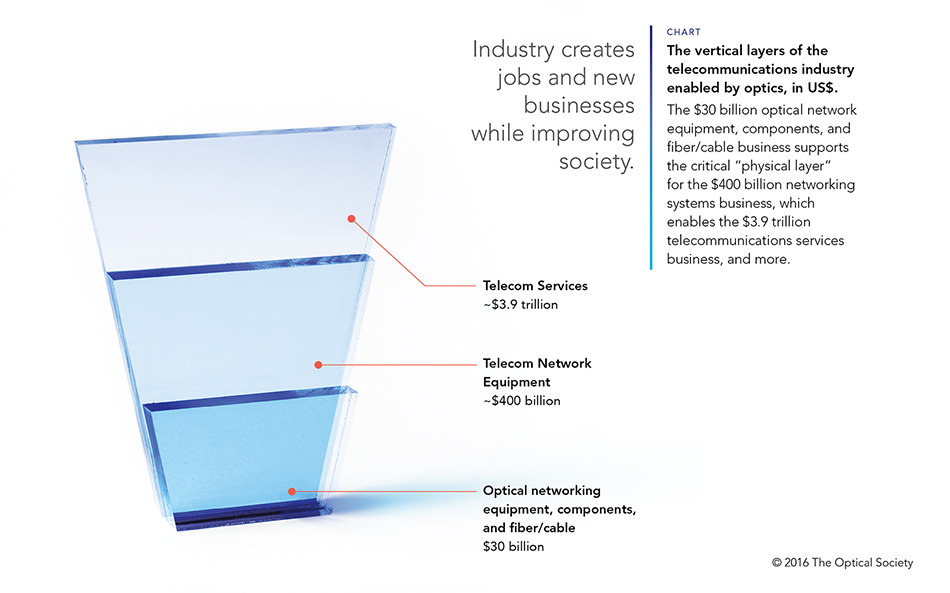
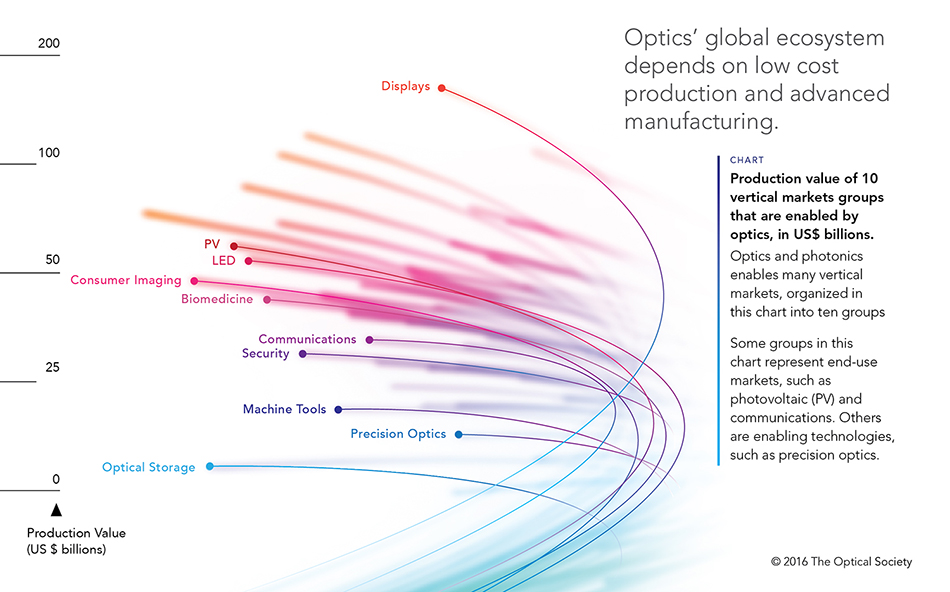
This industry brochure highlights the financial and economic impacts of the optics and laser industries. It is a set of inter-connected financial data, told through the lens of the optical society. The data visualizations, therefore, took inspiration from the content: light, photonics, the color spectrum and especially the laser technology.
All images used in this brochure are created in-house, including this cover image.
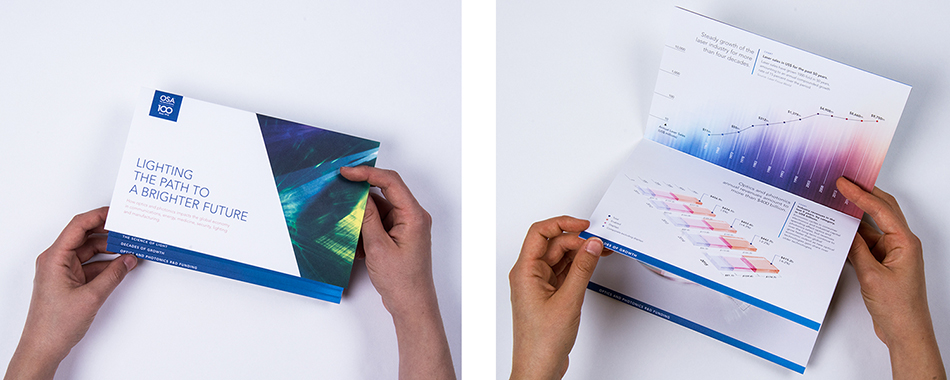
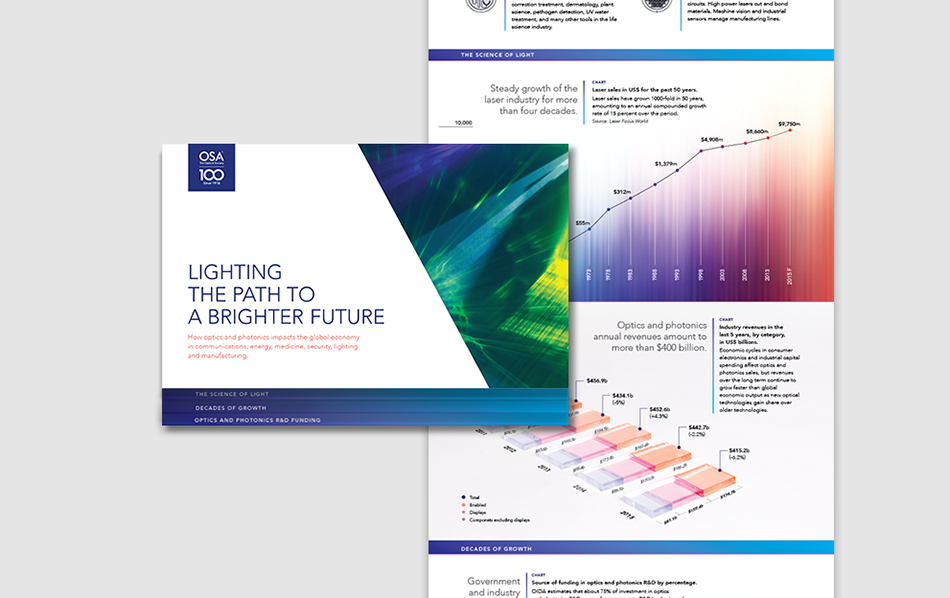
As part of the information architecture, we proposed the use of tabs. They serve as a navigation system that connects the different data sets together.




Role: Lead graphic designer, information architecture, content editor (in direct communication with Client and Project Manager), production designer, photographer, photo production.
Senior Designer: Eliza Fitzhugh. Designer: Daniel Rodriguez. Project Manager: Leah Kassell. Partner-in-Charge: Maya Kopytman.
Year: 2015